

As global industry looks beyond volatility management and into structural planning, 2026 marks a decisive inflection point for energy and feedstocks. The question is no longer whether energy costs will fluctuate—but which regions, industries, and trade models will structurally benefit or lose as cost curves realign.
Gas, oil, naphtha, coal, and electricity prices are no longer moving in parallel. Regional divergence is accelerating. For petrochemicals, fertilizers, metals, and industrial manufacturing, feedstock economics are becoming the primary driver of trade competitiveness.
This article analyzes the energy feedstock outlook 2026, explains how cost curves are shifting, and outlines what this means for sourcing, production location, and global trade flows.
1. Why 2026 Is a Cost-Curve Year
2026 is not just another forecast year—it is the point where temporary distortions harden into structural differences.
Key forces shaping this shift:
| Driver | Structural Impact |
|---|---|
| Energy transition investments | Uneven cost recovery |
| LNG market rebalancing | Regional gas price divergence |
| Refinery rationalization | Naphtha & middle distillate shifts |
| Carbon pricing expansion | Embedded energy cost increase |
| Grid constraints | Electricity cost volatility |
The result: energy costs by region will no longer converge. They will define winners and losers.
2. Natural Gas: The Most Critical Feedstock Variable
Natural gas remains the single most important feedstock across:
-
Fertilizers (ammonia, urea)
-
Hydrogen production
-
Methanol
-
Power generation
-
Industrial heat
2026 Outlook:
-
North America: structurally low-cost gas
-
Middle East: stable, policy-managed pricing
-
Europe: improved supply vs 2022–23, but structurally higher than peers
-
Asia: LNG-linked volatility remains
This divergence reshapes trade flows:
-
Energy-intensive products gravitate toward low-gas-cost regions
-
High-cost regions shift toward import dependency or downstream specialization
3. Oil, Naphtha & Liquid Feedstocks
Oil prices in 2026 are expected to remain range-bound, but downstream feedstocks tell a different story.
Key dynamics:
-
Refinery closures in Europe tighten naphtha availability
-
Increased petrochemical demand competes with fuel blending
-
Freight & insurance add volatility to liquid feedstock pricing
For petrochemicals:
-
Naphtha-based producers face margin pressure in high-cost regions
-
Integrated producers with captive feedstock gain advantage
This pushes trade toward:
-
Export of polymers & chemicals from cost-advantaged regions
-
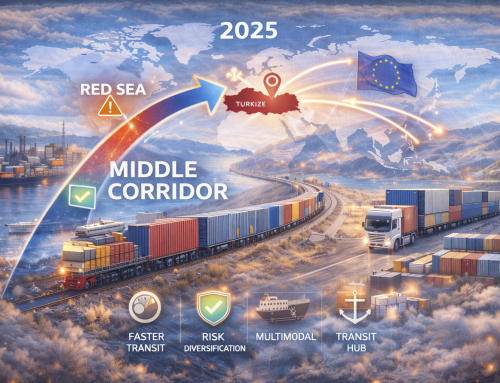
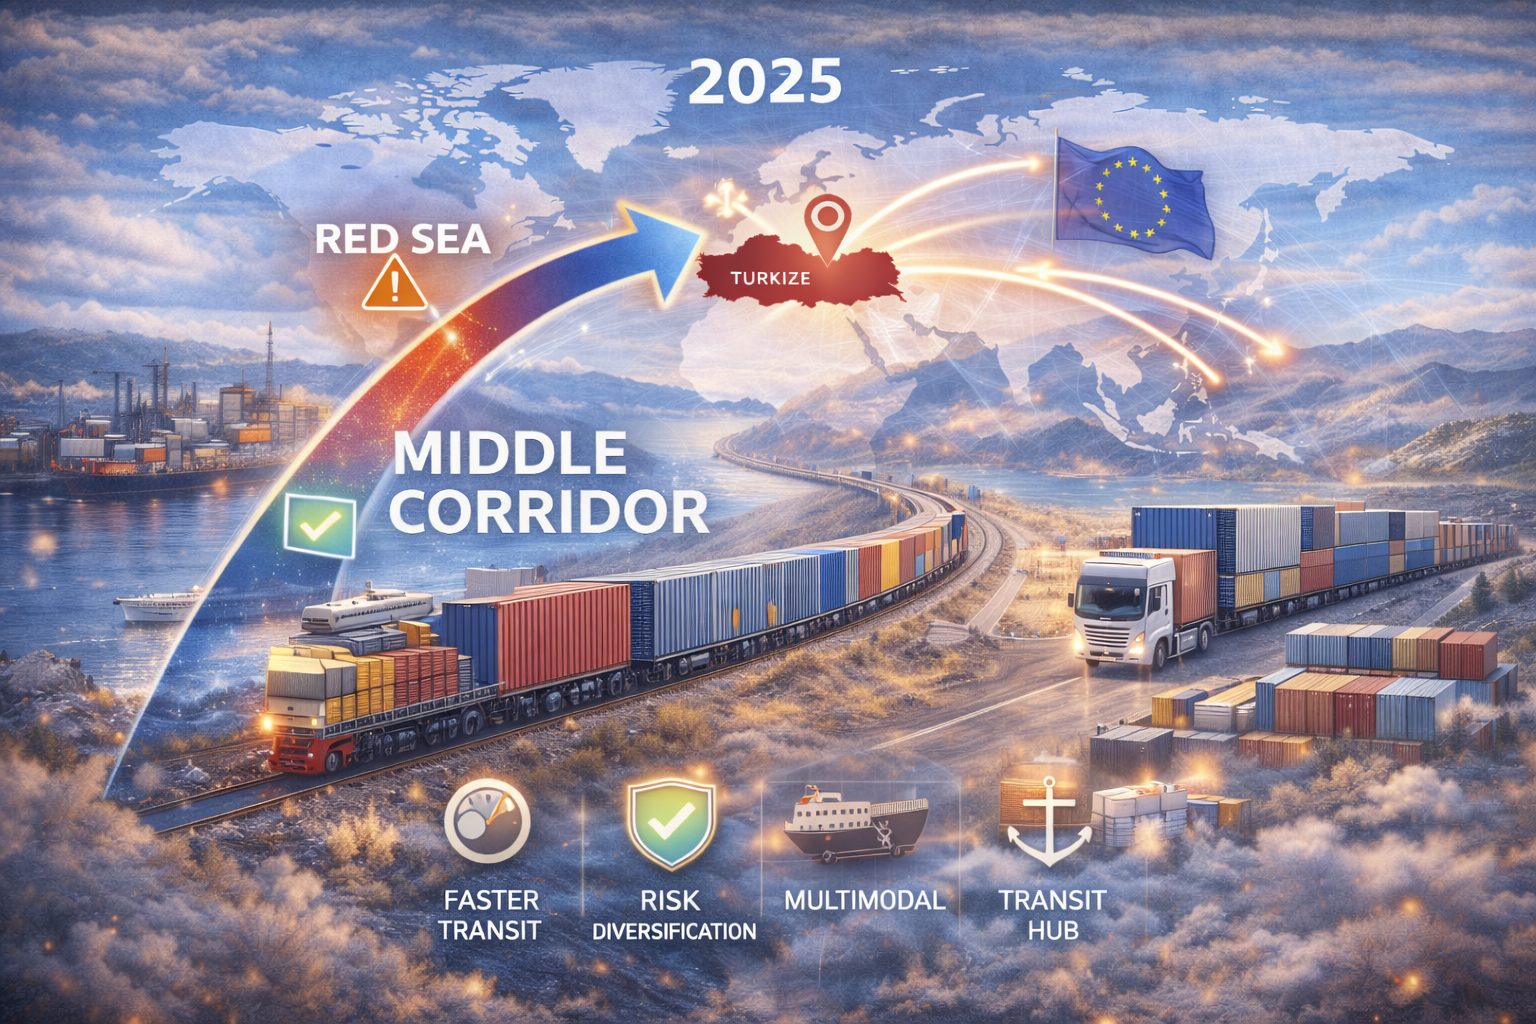
Increased arbitrage through hubs like Türkiye
4. Electricity: The Silent Cost Curve
Electricity is emerging as a decisive cost input for:
-
Aluminum
-
Steel (EAF)
-
Chemicals
-
Advanced manufacturing
In 2026:
-
Renewable-heavy grids reduce marginal cost—but increase volatility
-
Grid congestion and capacity constraints create price spikes
-
Carbon-linked power pricing embeds compliance cost
Industries increasingly evaluate electricity intensity per unit of output, influencing:
-
Plant location decisions
-
Contract manufacturing models
-
Trade vs local production choices
5. How Cost Curves Will Reshape Trade Flows
When feedstock costs diverge, trade responds predictably.
Expected 2026 shifts:
-
Fertilizers & basic chemicals export from low-gas regions
-
Higher imports into Europe & parts of Asia
-
Downstream processing moves closer to demand centers
-
Trading hubs gain importance as balancing points
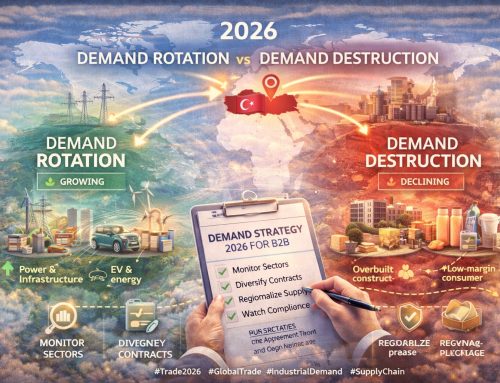
Türkiye’s role strengthens as:
-
A conversion and redistribution hub
-
A bridge between low-cost feedstock regions and demand markets
-
A staging point for cost-optimized trade flows
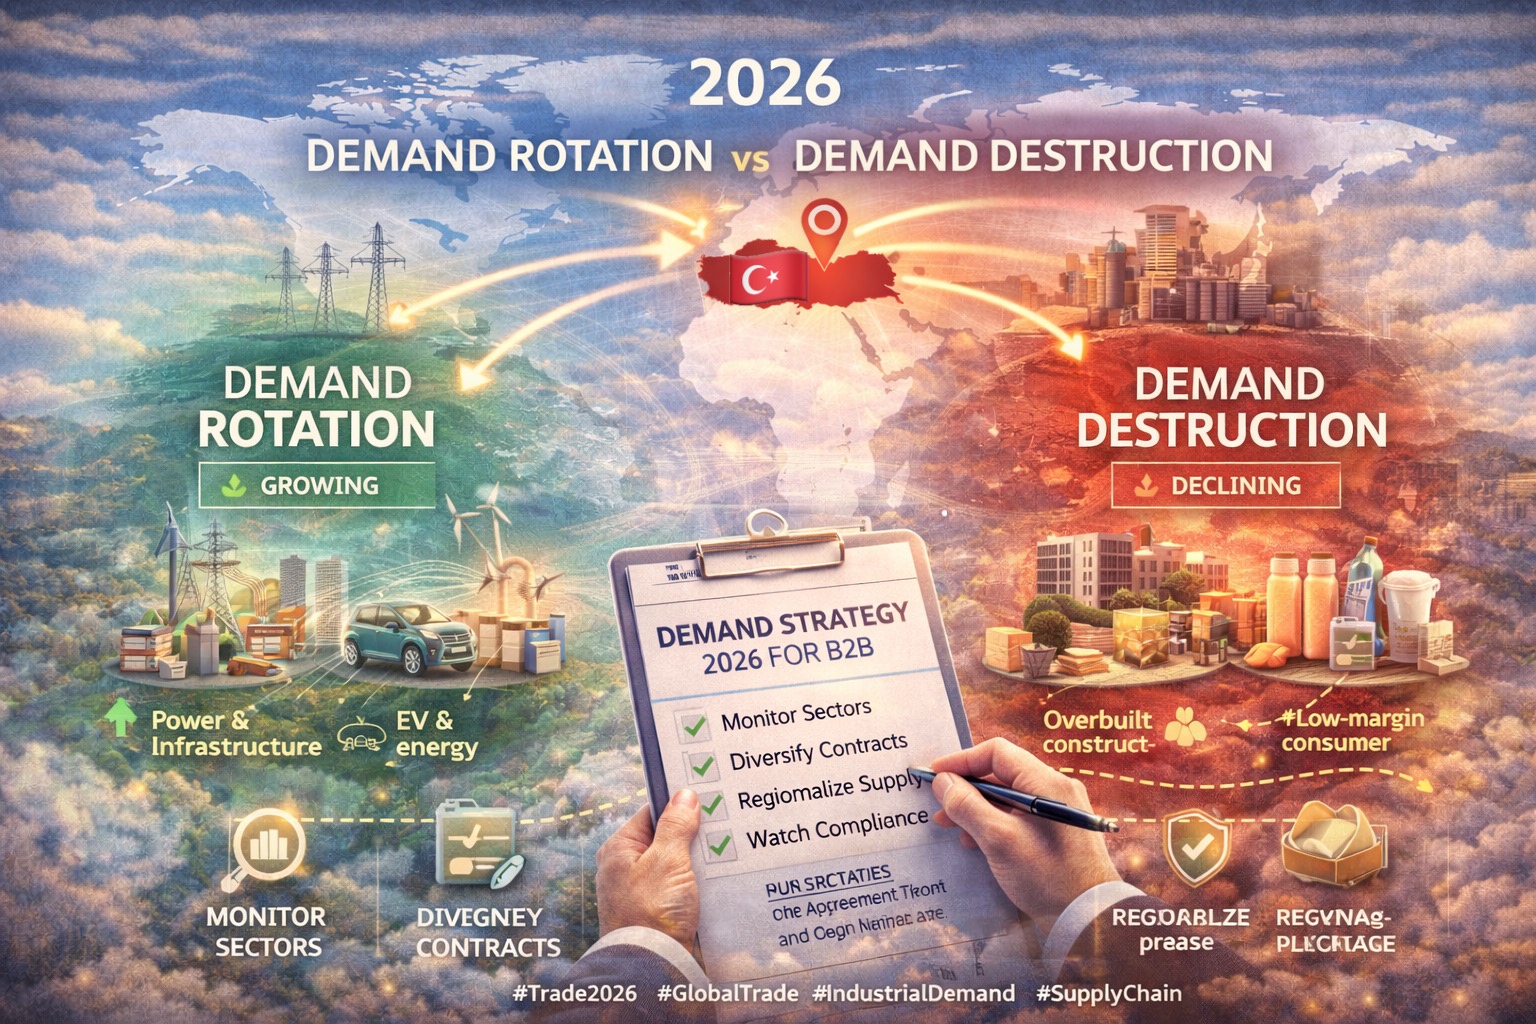
6. Strategic Implications for B2B Buyers & Traders
For 2026 planning, leading companies will:
📌 Track feedstock-linked cost curves, not just product prices
📌 Diversify sourcing based on energy intensity
📌 Build contracts that reflect regional energy risk
📌 Use hubs like Türkiye to arbitrage cost differences
📌 Avoid locking into structurally high-cost supply
Energy is no longer a background variable—it is the core competitive axis.
Conclusion — 2026 Is About Structural Advantage
The energy feedstock outlook 2026 signals a clear message: cost structures are fragmenting, not stabilizing.
Companies that align sourcing, production, and trade strategy with energy reality will gain durable advantage. Those that treat energy as a short-term fluctuation will face margin compression and strategic vulnerability.
In 2026, industrial trade success will be defined less by volume—and more by where your energy comes from.
Internal Linking Suggestions:
-
Raykan Products → /products
-
Logistics & Trade Services → /services
-
About Company → /about us
-
Contact → /contact us
about
Raykan
Together, let’s shape the future of industry. Focused on Reliability, Quality & Value

